
See how your spending changes with Spending Trends
On the phone, see your income and expenses month by month, how your expenses split across categories and how each category changes.
Only in the mobile app
The Spending Trends screen draws three charts from your transactions: your income and expenses month by month, how your expenses split across categories, and how each category changes from month to month.
Before you start
Every plan includes it, on the mobile app only. It shows the transactions you have already recorded.
Steps
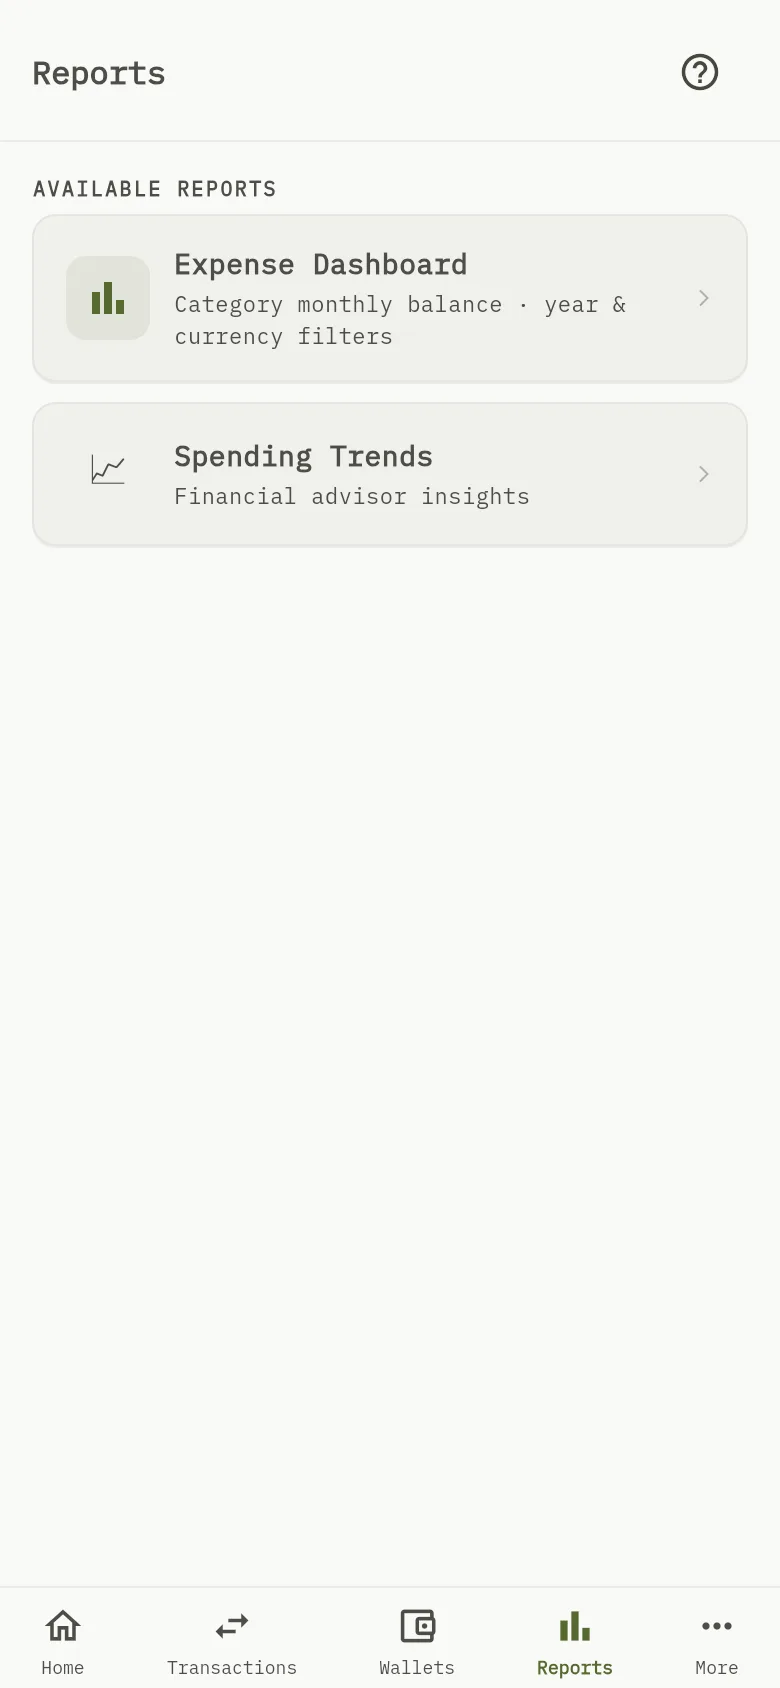
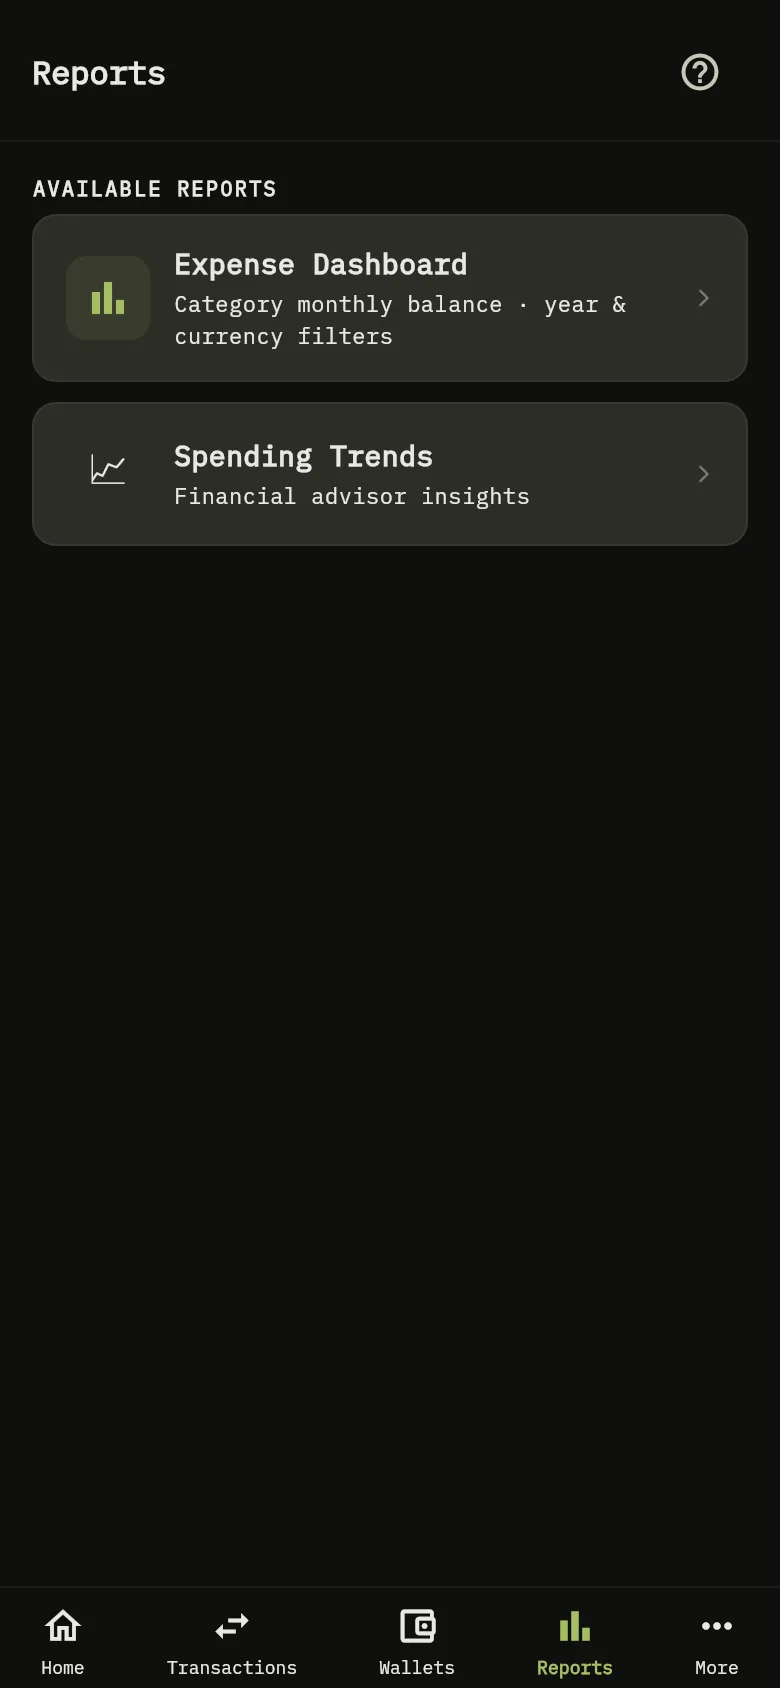
- Tap Reports at the bottom of the screen, then tap Spending Trends Marker 1.
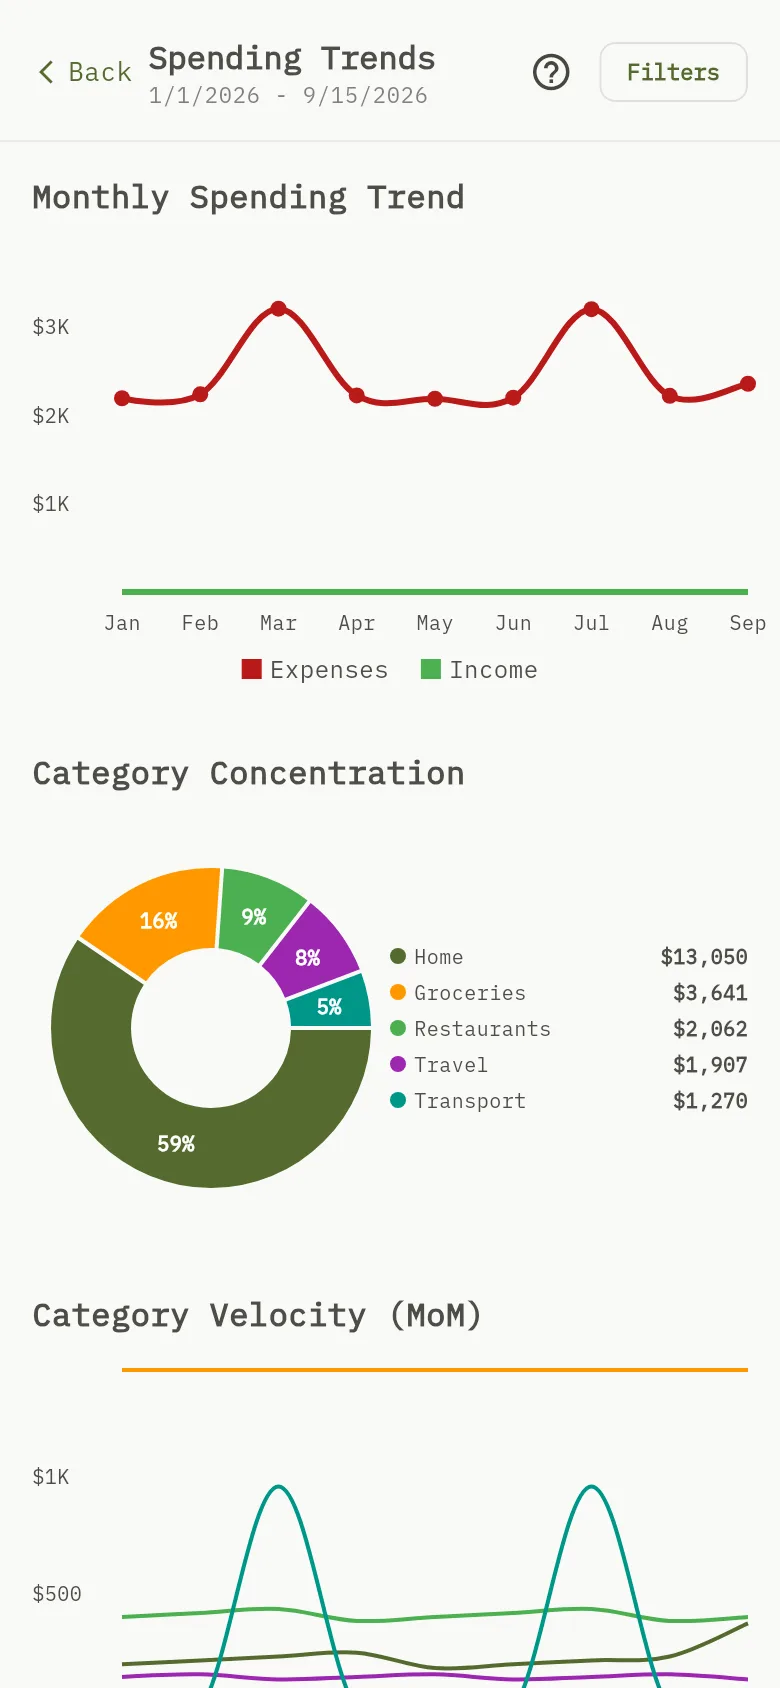
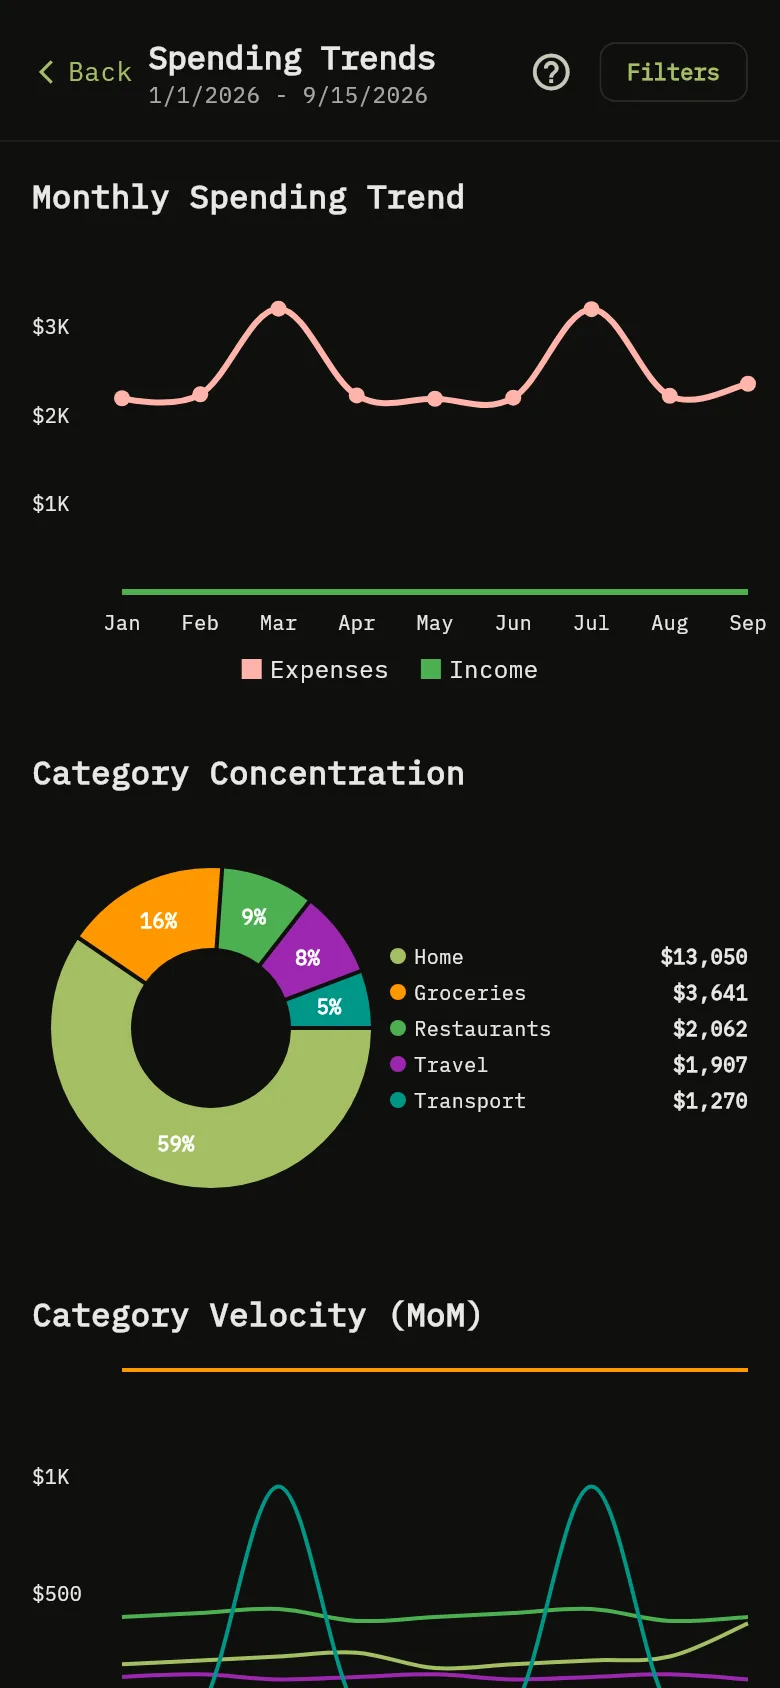
- Read the dates under the title. The dates are the starting values when the screen opens: the period starts on January 1 of this year and ends today. The filters change them.
- In Monthly Spending Trend Marker 2, the red line is your expenses and the green line is your income, with a point for each month. Touch a point to see its amount.
- In Category Concentration Marker 3, the pie shows how your expenses split across categories, with each slice’s share and the list of amounts beside it. It names up to six categories. When you have more, it shows the five biggest and groups the rest as Other.
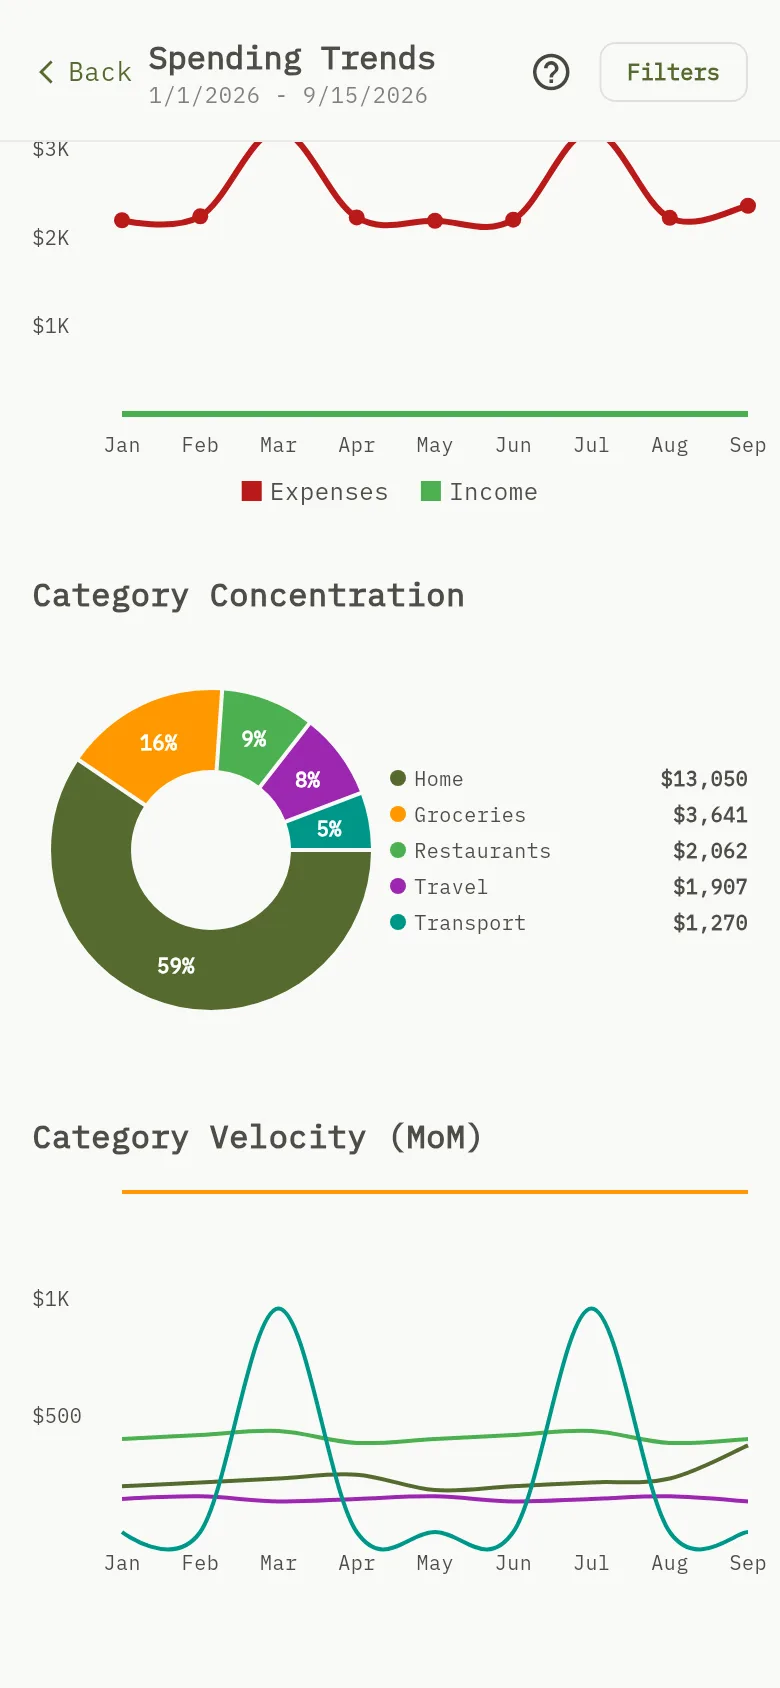
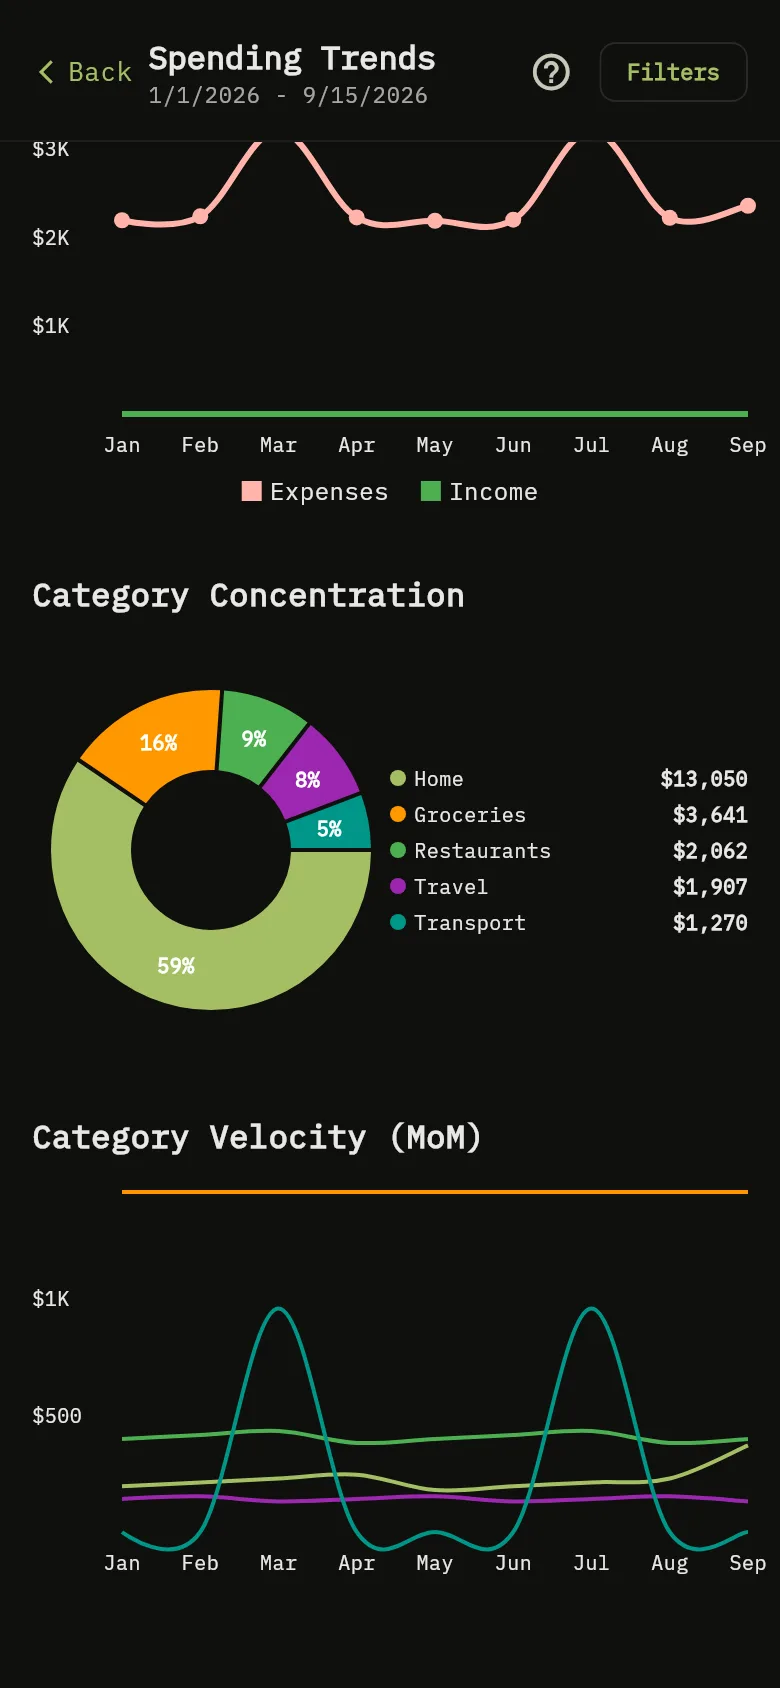
- Scroll down to Category Velocity (MoM) Marker 4. Each line is one category, with a point for each month, so you can see which categories grow or shrink. Touch a point to see the category and its amount. Categories with no spending in the period are left out.
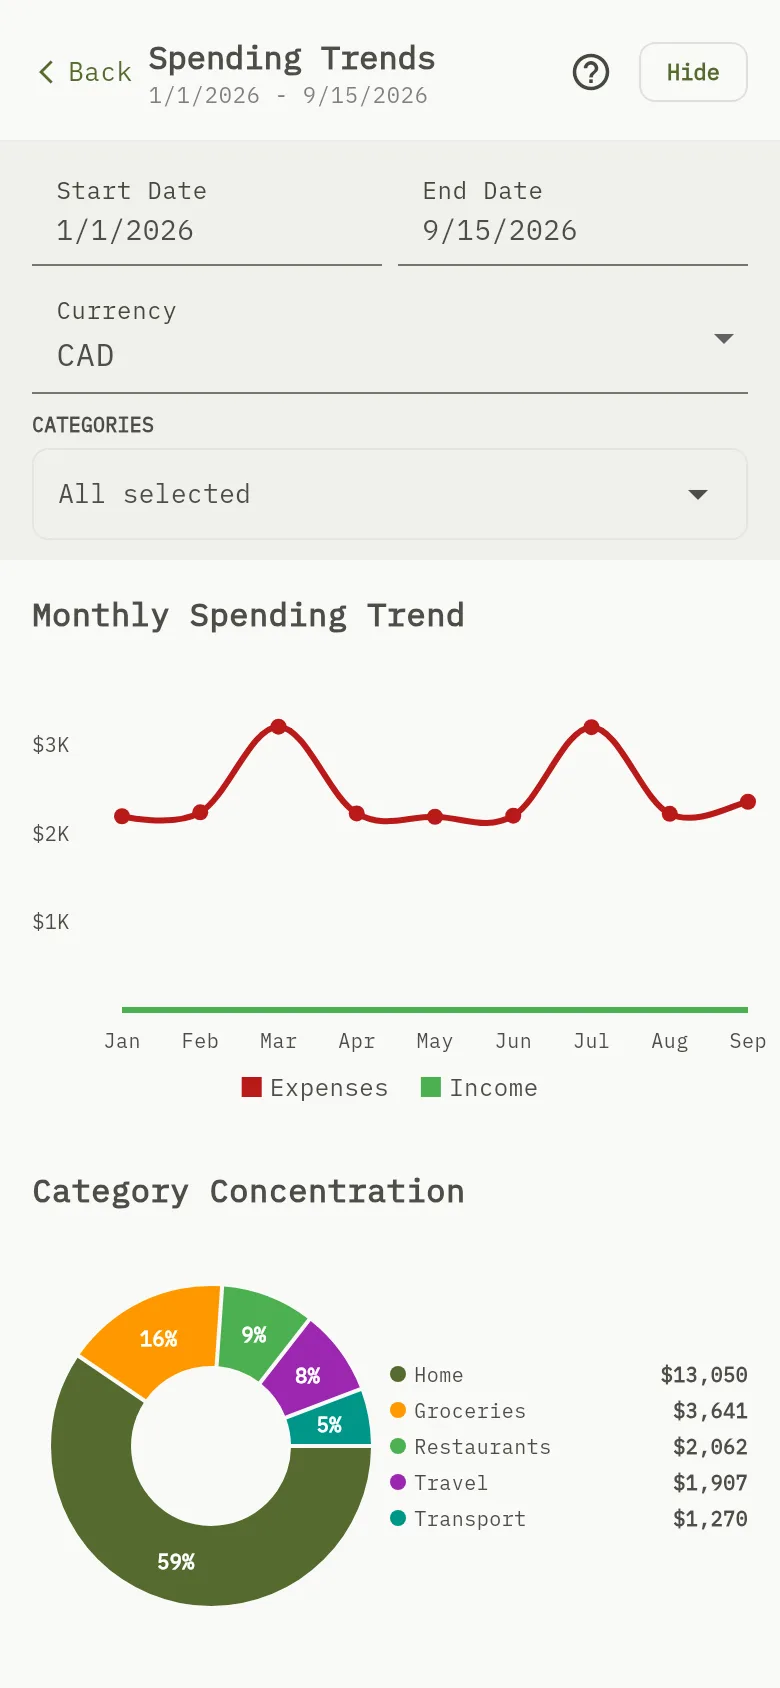
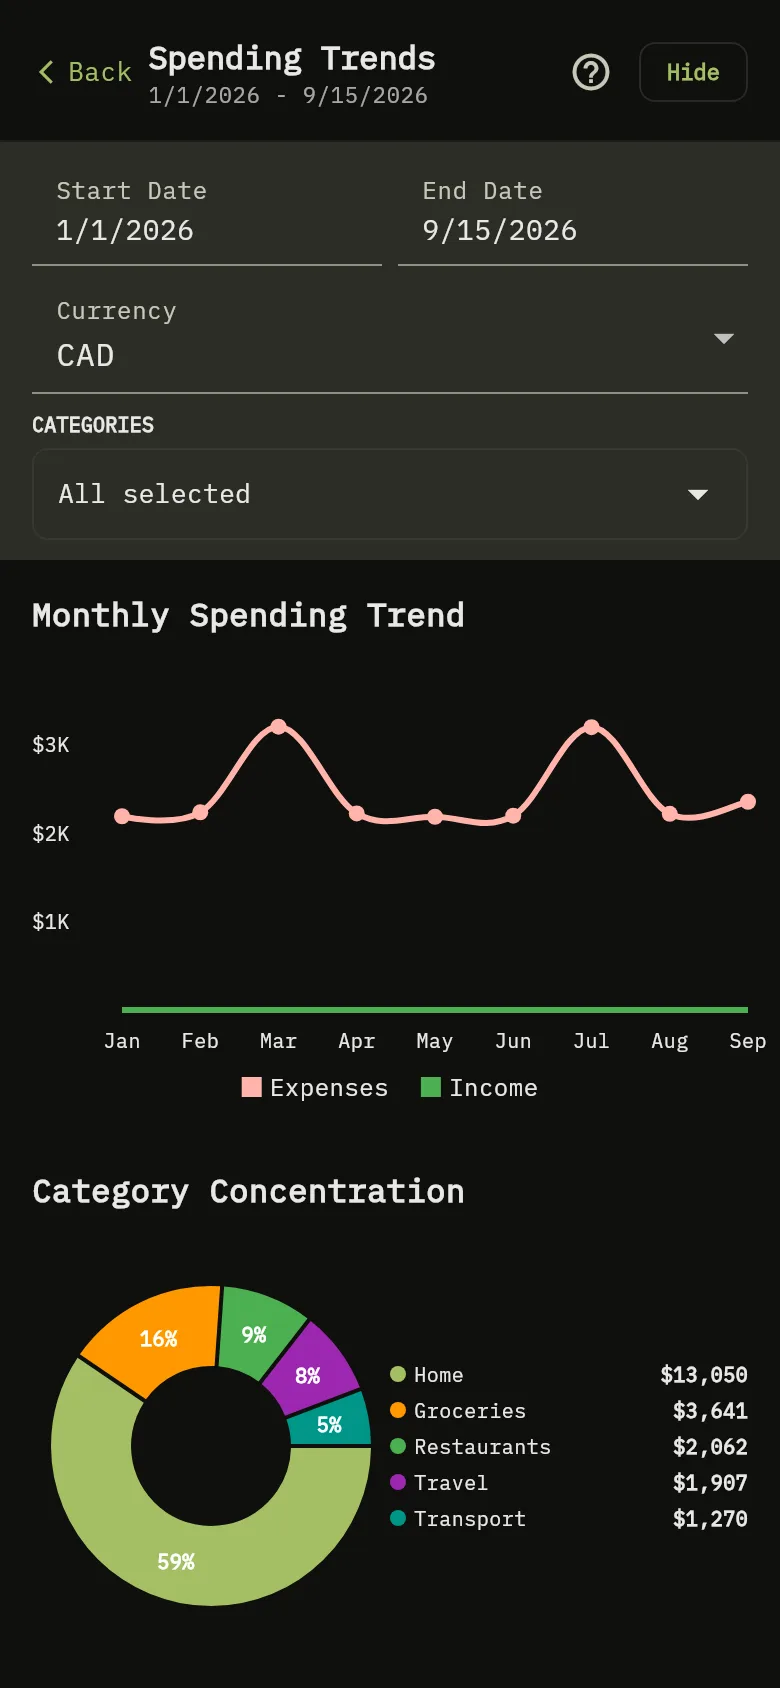
- Tap Filters Marker 5 to open the filters, and tap Hide to close them.
- Change the period with Start Date and End Date Marker 6. If you pick more than five years, the charts show the last five.
- Choose the Currency Marker 7 that the amounts are shown in. The Expense Dashboard uses the same choice.
- Choose the categories Marker 8 for the pie and the velocity chart. All are selected at first. The monthly chart always counts every category.
Tip
Start Date, End Date, Categories, Expenses, Income, Other and Uncategorized are in English in every language.
How the numbers are counted
Amounts in other currencies are converted into the currency you chose with your exchange rates. When there is no rate, the amount counts 1:1, as everywhere in the app. Wallet currencies and balances explains it.
Tip
The monthly chart counts the expenses of every category, whichever you choose. A transaction with no category appears in the pie as Uncategorized. A transfer is not counted, except its exchange cost, which the monthly chart counts as an expense.
What you see
Three charts for the same period and currency. The pie and the velocity chart also follow your choice of categories; the monthly chart does not.
Related
See where your money goes with the Expense Dashboard, Choose the categories you use.