
See where your money goes with the Expense Dashboard
Add up your income and expenses by category or provider, month by month. On the web you can also group by wallet or tag.
The Expense Dashboard adds up your transactions by category, provider, wallet or tag, month by month, so you can see where your money goes.
Before you start
Every plan includes it. It shows the transactions you have already recorded.
Steps
Web
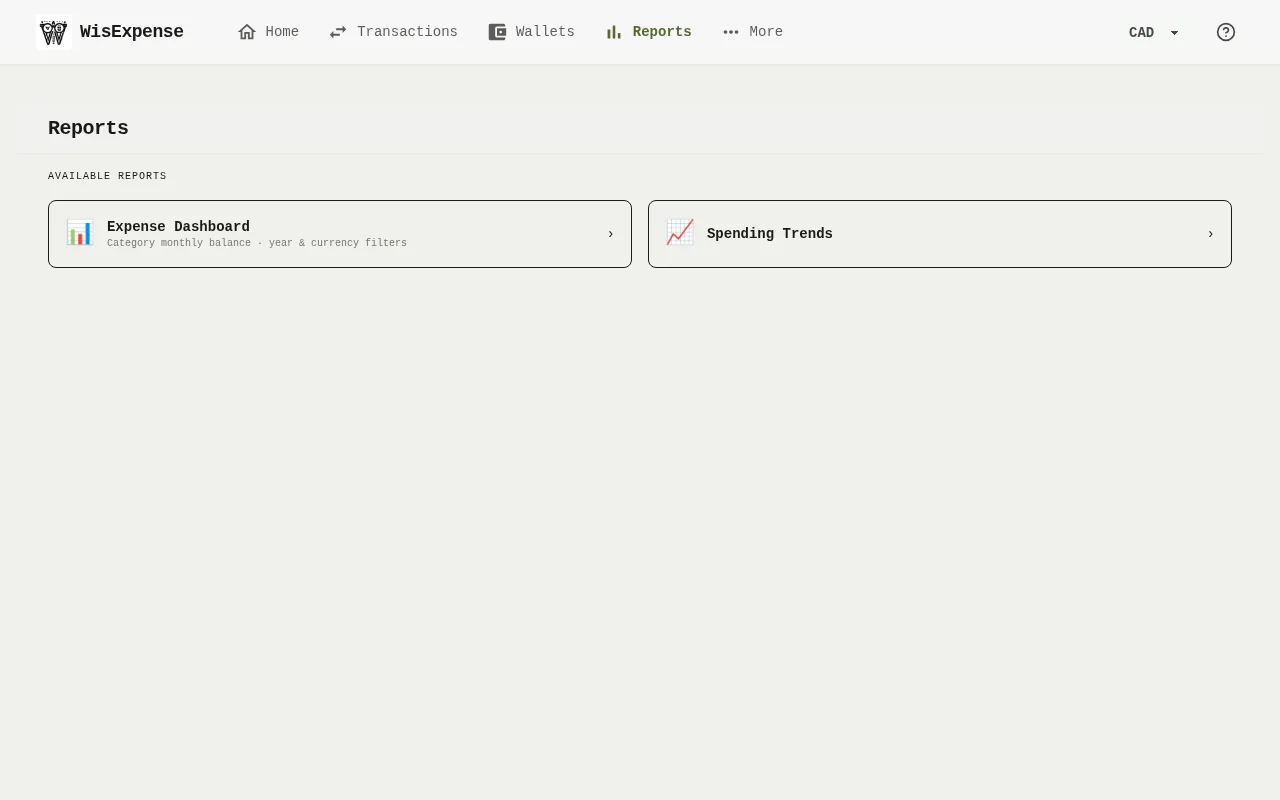
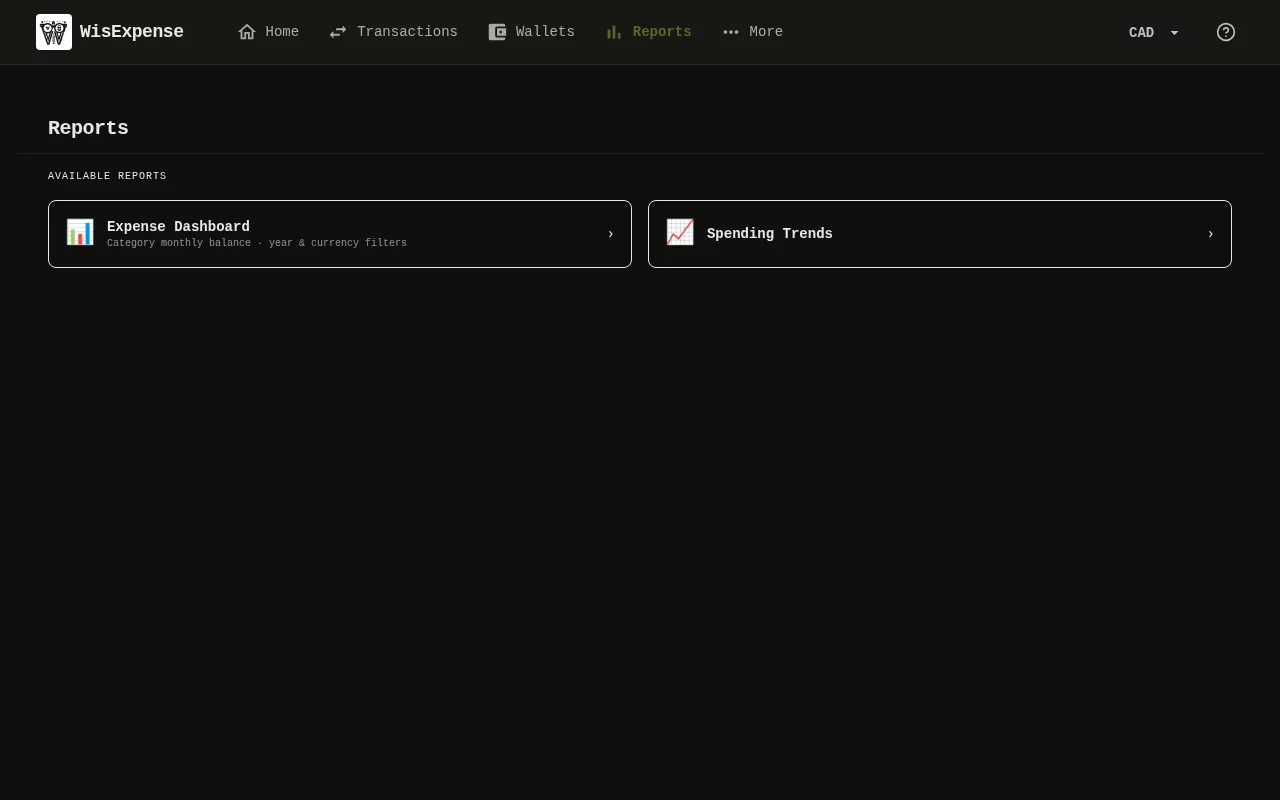
- Select Reports in the menu, then select Expense Dashboard Marker 1.
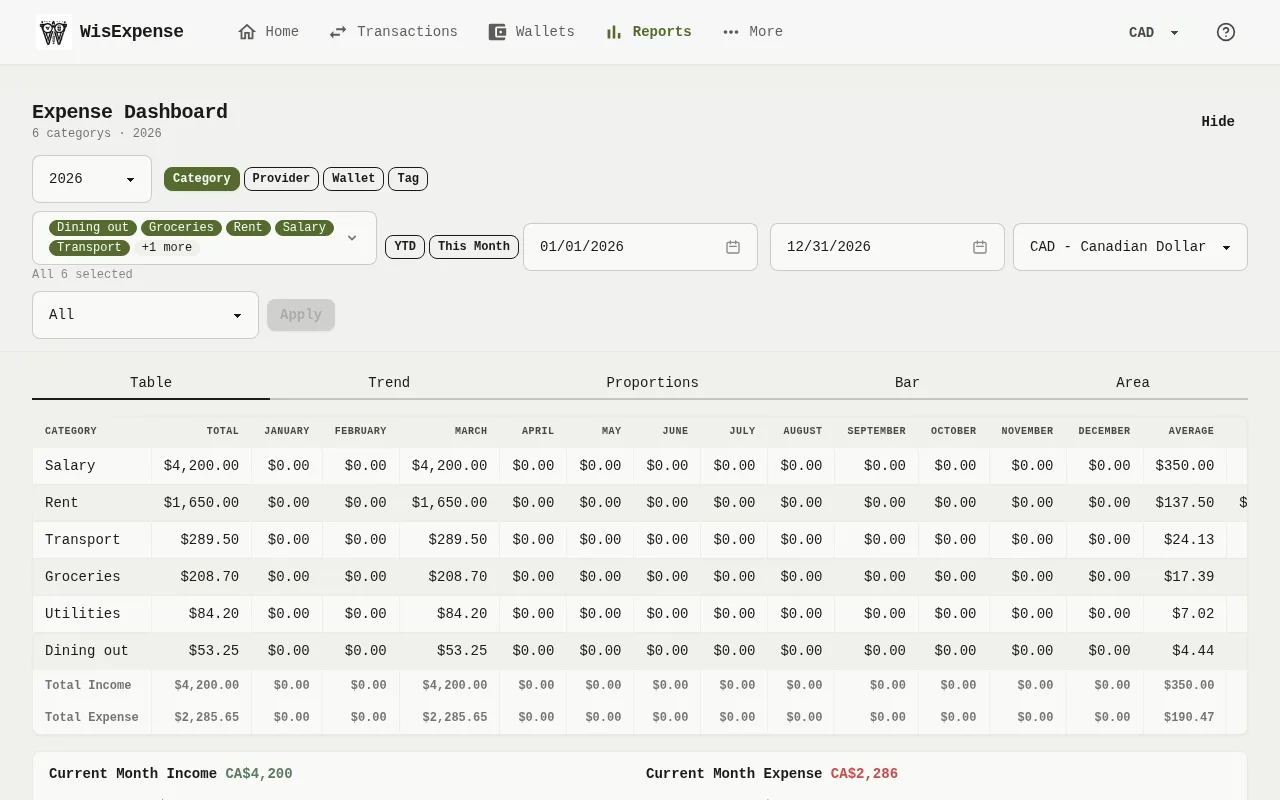
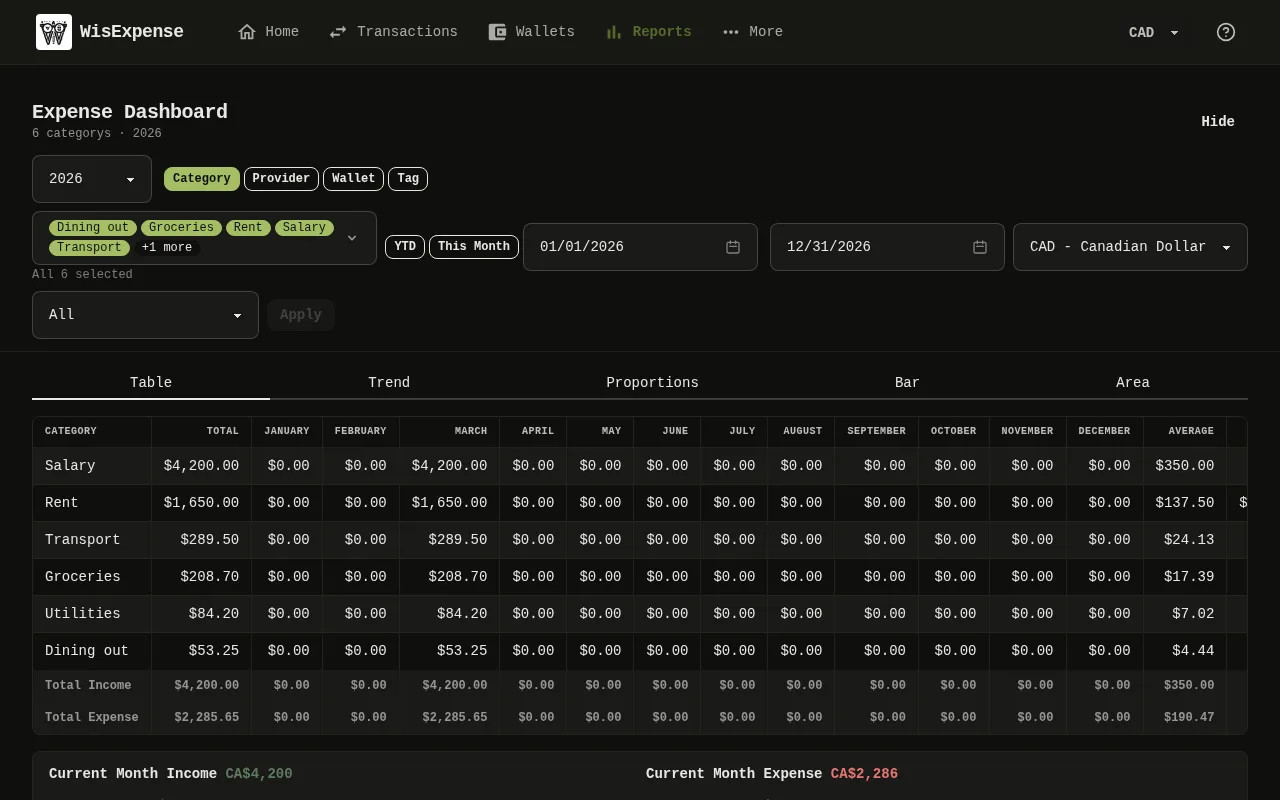
- Choose what to group by Marker 2: Category, Provider, Wallet or Tag. These four buttons, the month names, the column headers and the Total Income and Total Expense rows are in English in every language. Grouping by wallet or tag is web only.
- Pick the items to include Marker 3. They are all selected at first. Select Apply to update the report.
- Set the period Marker 4, or select YTD for the year so far or This Month.
- Choose the currency the amounts are shown in. A second list can limit the report to transactions in one currency.
- Read the table Marker 5: one row per item, the total, then, on a wider screen, a column for each month and, on a wide screen, the average, lowest and highest month. Underneath, Income (Range), Expense (Range) and Total (Range) add up the period.
- To see the same numbers as a chart, select Trend, Proportions, Bar or Area under the title, and Table to go back to the numbers. Select Hide to make room, and Filters to bring the filters back.
Mobile
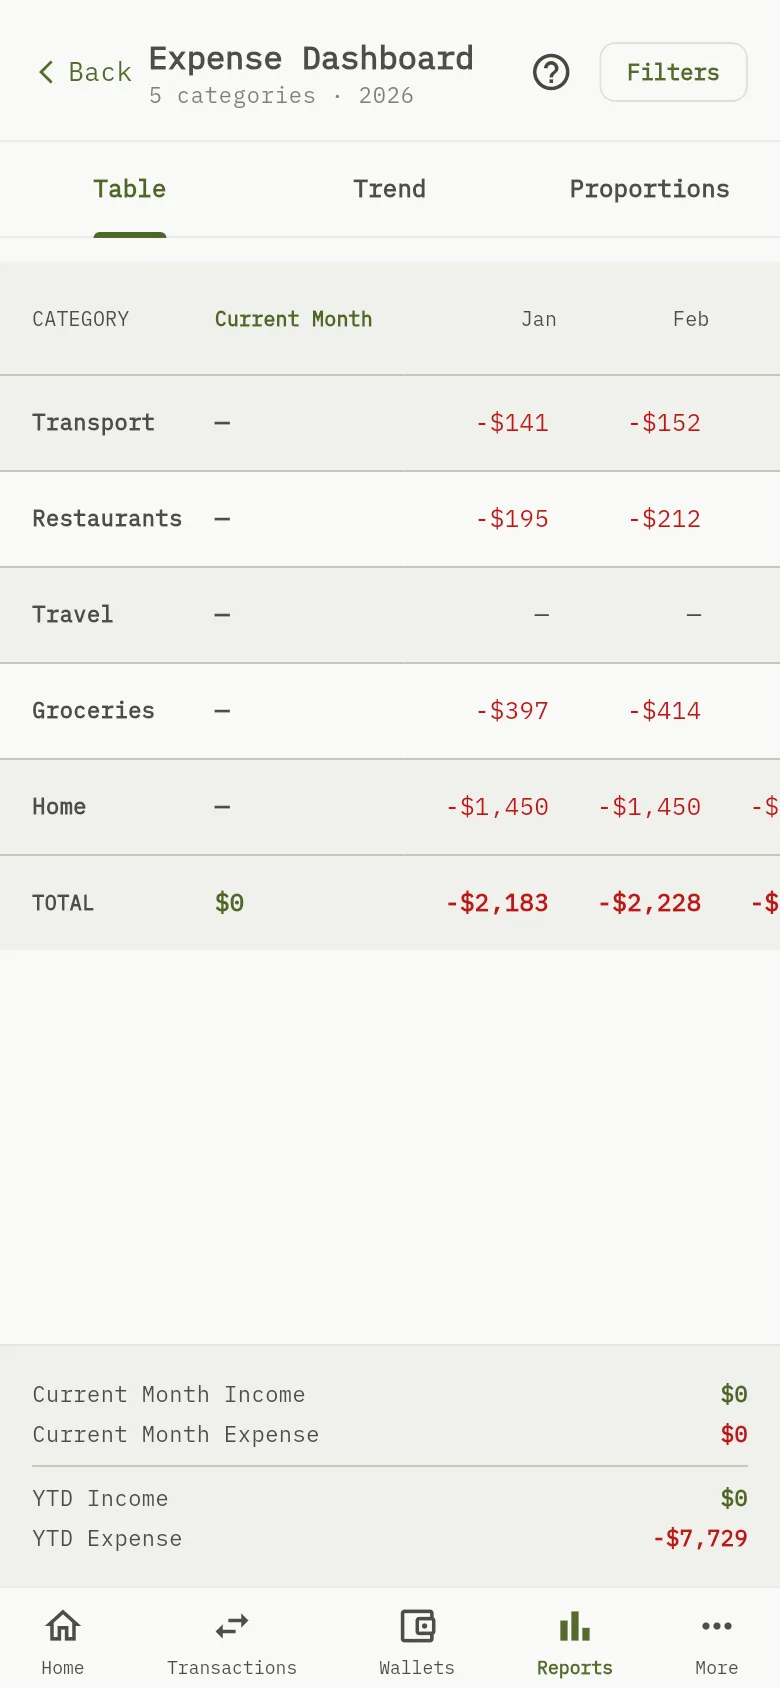
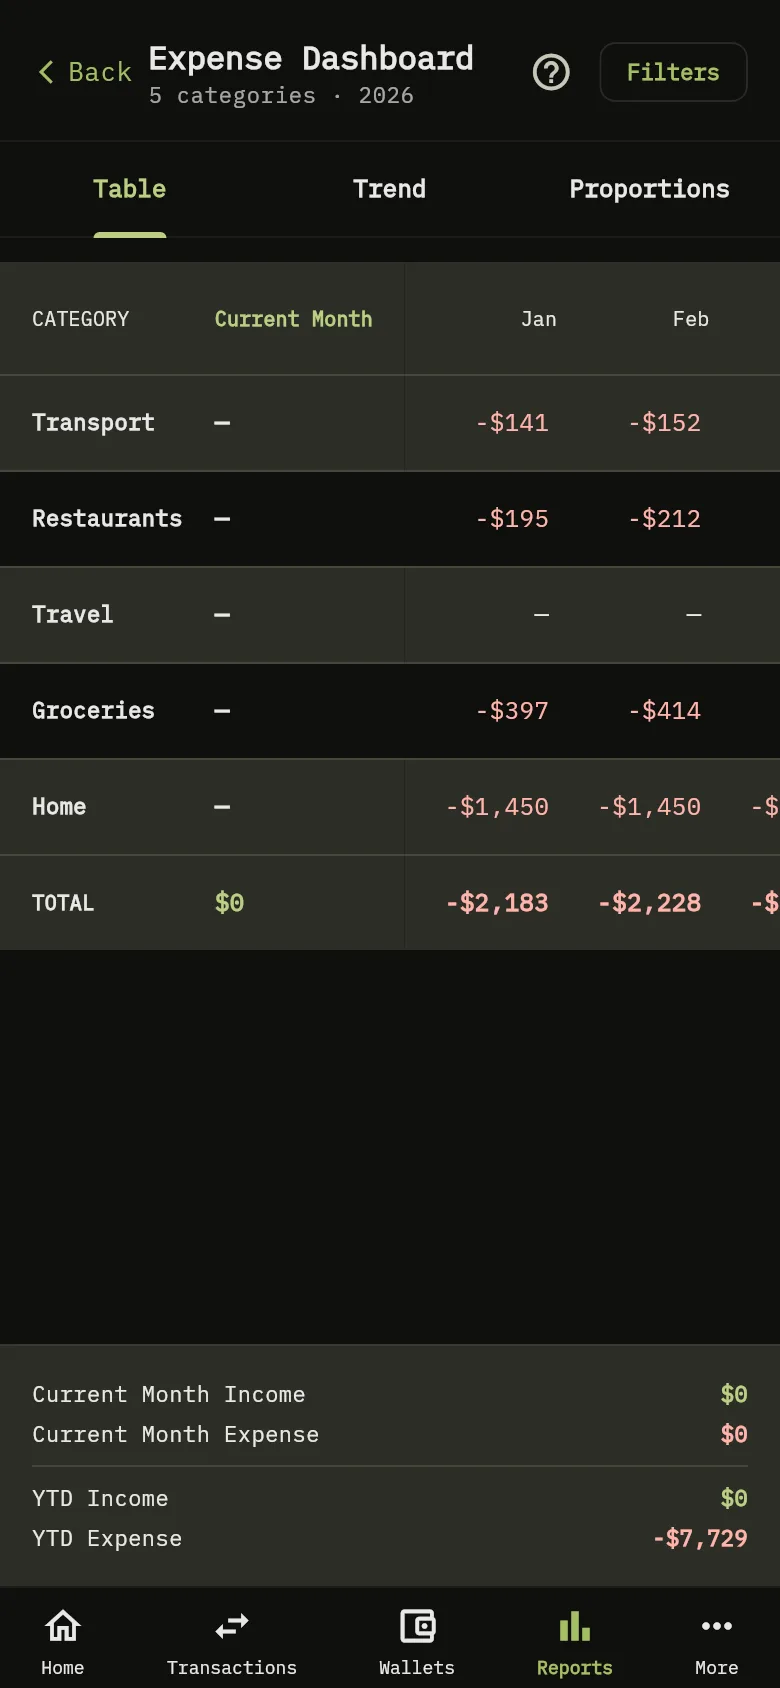
- Tap Reports at the bottom of the screen, then tap Expense Dashboard.
- Tap Filters Marker 6 to choose the Year, the Currency, the Type (Category or Provider only) and which items and tags to include. Tap it again to hide the filters.
- Use the three tabs Marker 7: Table, Trend and Proportions. These three names are in English in every language.
- The table has a row for each item, with the current month first and then each month. TOTAL adds up each column. Trend draws the monthly totals as a line, and Proportions shows this month’s expenses as a pie. There is no bar chart on mobile; bar charts are web only.
- At the bottom, Current Month Income, Current Month Expense, YTD Income and YTD Expense sum up the month and the year so far for the selected Year. For a past year, they show that year.
How the numbers are counted
Amounts in other currencies are converted into the currency you chose with your exchange rates. When there is no rate, the amount counts 1:1, as everywhere in the app. Wallet currencies and balances explains it.
Tip
On the web, a transaction with no category is left out of the item rows when you group by category, but the Total Income and Total Expense rows and the figures underneath still count it. On mobile, it appears in a row called Other.
Tip
The web app shows every amount without a sign, except a negative Total (Range), and keeps income and expense apart underneath. The mobile app shows expenses as negative amounts in red.
What you see
The table, or the chart you chose, shows your totals for the period. The figures underneath count every income and expense transaction in the period (not transfers), whichever items you picked; only the second currency list narrows them.
Related
Choose the categories you use, Add and edit providers, Label transactions with tags.
On mobile, See how your spending changes with Spending Trends goes further.